
A 67M-unit industrial consumer, optimised
How multi-scenario simulation at 15-minute resolution turned a swinging industrial load and a tightening settlement regime into a decision-grade renewable energy plan.
On this page · 8 sections
The Consumer#
An energy-intensive industrial consumer drawing roughly 67 million units a year — a load large enough that energy is a board-level cost line, and complex enough that no two months look alike. Production schedules, process cycles, and seasonal patterns swing the monthly demand significantly, and the consumption shape within each day is anything but flat.
The consumer had a clear mandate: reduce energy cost and carbon intensity with renewables. What it did not have was a defensible answer to the questions that follow — how much capacity, in what mix of technologies, under which contractual structure, and with what confidence in the returns.
The Constraint That Changed the Question#
The consumer's market was moving to tighter 15-minute settlement for open access and captive consumers. Under the older, more forgiving accounting, a simple volumetric analysis, annual generation versus annual consumption, would have passed for diligence. Under block-wise settlement it would have been systematically wrong: every midday surplus and every evening deficit settles on its own terms, at that block's rates, under that market's banking and deviation rules.
The sizing question, in other words, was no longer "how many units do we need?" but "which 15-minute blocks are we solving for — and what does each one cost?"
What We Modelled#
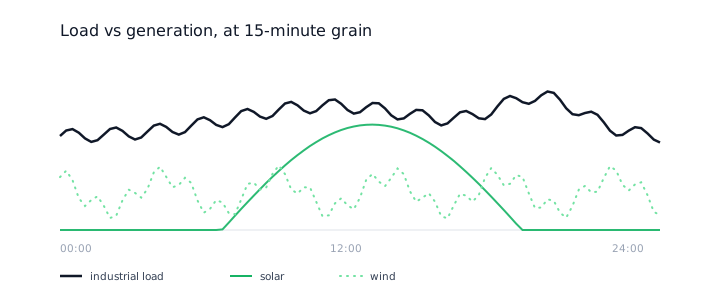
EarthSync's planning engine built the analysis from the consumer's own interval data: consumption, generation, and storage simulated at 15-minute resolution across a full year — every block evaluated against the applicable market rules, including time-of-day tariff slabs, banking provisions, open access charges, and the deviation settlement mechanism as it applied to the consumer.
On the generation side, the engine simulated candidate solar and wind profiles at the same resolution, capturing seasonal and intra-day variability rather than annualised capacity factors. Storage was modelled as a dispatchable asset whose charge and discharge in every block is decided by the optimiser — not by a fixed daily cycle.
Seven Scenarios, One Optimisation Frame#
Rather than evaluate a single proposed configuration, the engine ran seven Solar–Wind–BESS scenarios spanning renewable offset targets from 50% to 70% of consumption. Each scenario was independently optimised as a linear program: the solver chose the capacity mix and the block-by-block storage dispatch that maximised the scenario's economics, with every one of the year's 35,040 blocks priced under the applicable rules.
Because every scenario was scored against the same 15-minute market rules, the comparison was genuinely like-for-like: not seven vendors' spreadsheets with seven sets of assumptions, but one physics-and-rules engine ranking seven futures.
What the Simulation Surfaced#
The block-level view changed the answer in ways an annual analysis could not have seen:
- Solar alone hit a ceiling: beyond a point, each additional megawatt of solar produced surplus in exactly the blocks that already had surplus — energy the settlement rules discounted heavily. The marginal value of solar capacity fell well before the offset target was reached
- Wind changed the shape, not just the volume: wind delivered into evening and night blocks that solar could not reach — blocks carrying the highest grid tariffs. Blends that annual accounting would rank as equivalent separated sharply once the delivery shape was priced
- The battery was sized by the rules, not the load: the optimal storage configuration was driven less by backup requirements than by the settlement regime — absorbing midday surplus that would otherwise be lost to banking haircuts, and discharging into the peak-tariff evening blocks
- The cheapest energy was not the best project: scenarios ranked differently on LCoE than on IRR once charges and settlement exposure were priced in. The configuration with the lowest cost of energy was not the one that maximised the return on the consumer's capital
Decision-Grade Outputs#
Each scenario emerged from the engine with a complete financial characterisation: levelised cost of energy, project IRR, equity IRR, DSCR, payback period, and NPV of savings — built up from 15-minute cash flows to annual statements across the project life. The consumer's leadership could compare seven configurations on the metrics an investment committee and a lender actually use, with every number traceable to block-level simulation rather than annualised assumptions.
Sensitivity runs across capex, tariff escalation, and degradation assumptions showed how each scenario's returns held up when the assumptions moved — separating configurations that were optimal on paper from those that were robust in practice.
Why the Shape of Consumption Decides the Saving#
A 67 million unit consumer is buying roughly 183,000 units a day, spread across 96 settlement blocks. What those units cost depends on which blocks they land in, and the cleared market separates them sharply: in June 2026 the 08:00 to 16:00 window averaged ₹1.63/kWh against ₹5.17 across the full day.
Sizing against the annual unit count treats all 67 million as interchangeable. They are not. A plant scaled to cover the total can still leave the consumer buying their most expensive blocks from the grid, and the shortfall shows up in the bill rather than in the generation report.
The Takeaway#
A 67-million-unit load under a 15-minute settlement regime is not one procurement decision — it is 35,040 pricing decisions a year, repeated for twenty-five years. Modelling it at that resolution did not just refine the numbers; it changed which configuration won. That is the difference between analysis that supports a decision and analysis that merely decorates one.