The two-gigawatt tenant: data centres are becoming India’s anchor load, and its most demanding clean-energy buyers
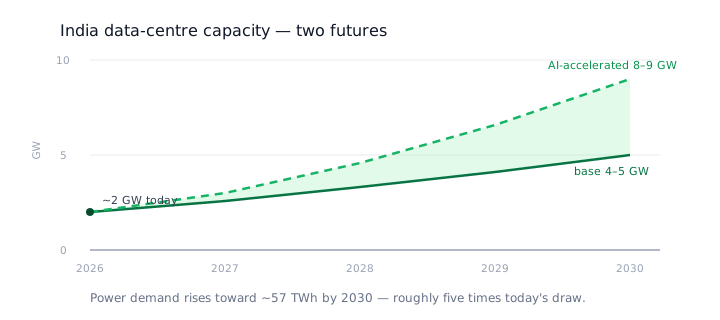
India’s data-centre fleet is set to double, then double again, roughly 2 GW today, about 5 GW by 2030 in base cases, 8–10 GW if the AI buildout accelerates. But the number that matters is not the megawatts. It is the shape: flat, always-on, and increasingly contracted to run carbon-free around the clock, a demand profile Indian power markets were never designed to serve.
On this page · 8 sections
A New Kind of Anchor Load#
Every phase of Indian grid expansion has had an anchor load that pulled investment behind it — railway electrification, aluminium smelters, agricultural pumping, then urban cooling. The 2020s have produced a new one. India’s installed data-centre capacity stands at roughly 2 GW as of 2026, with around 500 MW of fresh supply expected in 2026 alone — growth of about 30% year on year, per CBRE. Against a system peak north of 250 GW, two gigawatts sounds marginal. It is not, for three reasons: the load is extraordinarily concentrated, it is growing faster than any other demand category, and it belongs to the most creditworthy electricity buyers ever to enter the Indian market.
The capital commitments behind the buildout removed any doubt about durability. In December 2025, Microsoft announced a $17.5 billion, four-year commitment to Indian cloud and AI infrastructure — its largest in Asia. Google is putting $15 billion into a gigawatt-scale AI hub at Visakhapatnam, and AWS has committed more than $21 billion through 2030. Hyperscalers do not announce capacity they are unsure of filling — these figures are demand forecasts wearing the clothes of press releases.
A Fourfold Jump in Power Demand by 2030#
The forecast range is wide, and the width is itself the finding. Base-case projections cluster around 5 GW of data-centre capacity by 2030; AI-accelerated scenarios, in which training and inference workloads localise faster than expected, run to 8–10 GW. On the energy side, S&P Global projects data-centre power demand rising from about 13 TWh in 2024 to around 57 TWh by 2030 — more than a fourfold jump, comparable to the entire annual demand of a mid-sized Indian state.
Two properties of that demand deserve more attention than the headline. First, load factor: a data centre runs at 80–90% utilisation of its connected load, against perhaps 50–60% for typical heavy industry. A gigawatt of data-centre capacity therefore consumes energy like two gigawatts of conventional industrial connection. Second, the uncertainty band, the gap between the base case and the AI-accelerated one, is a planning problem in its own right. Whether the AI-accelerated case materialises will be decided in boardrooms in Seattle and Mountain View, not in the offices of Indian transmission planners, who must nonetheless build for a range that spans a factor of two.
A Load Built Backwards from Solar#
What makes data-centre demand analytically interesting is not its size but its geometry. The load is flat — a near-constant band across all 96 fifteen-minute blocks of the day, every day of the year. It is uptime-critical: availability commitments of 99.99% and above mean the load cannot be curtailed, shifted, or interrupted in response to price. And it arrives in a market whose marginal supply increasingly has the opposite shape — solar, which delivers a midday hump and nothing after sundown.
India’s intra-day price curve now reflects that mismatch in published clearing prices: near-zero midday blocks under surplus solar, and evening blocks that run into the $120/MWh ceiling as the sun sets into peak demand. For a flat-load buyer, this shape cuts both ways. Across the midday belly, a data centre is a useful anchor — a steady, largely price-insensitive sink for the cheapest utility-scale power India has ever produced. Across the evening neck, the same buyer is structurally short in precisely the blocks where the market is tightest — and, unlike a factory, it cannot respond by shifting a shift. A flat load buys the whole curve, every day, forever. That makes data centres simultaneously the best-positioned and the most exposed large buyers in the Indian market.
The standard corporate instrument, a flat-price PPA with a single solar plant, barely dents the problem. A solar asset generates for perhaps a quarter of the hours a data centre consumes. The remaining hours are grid or exchange exposure concentrated in the expensive end of the curve, which is exactly the exposure the PPA was signed to eliminate.
What 24×7 Carbon-Free Actually Requires in India#
Hyperscalers are not annual-matching buyers anymore. The procurement standard the largest of them have adopted — 24×7 carbon-free energy — requires matching consumption with clean generation in every hour, not netting it out across a year. That standard is arriving in India with real weight behind it: in 2025, four technology companies (Meta, Amazon, Google, and Microsoft) accounted for nearly half of all corporate clean-power PPA volume signed globally, per BloombergNEF. And Indian supply is, at the annual level, abundant — the country added a record 44.5 GW of renewable capacity in the first eleven months of 2025. The megawatt-hours exist. The shape does not.
Getting from a single solar PPA, perhaps 20-something percent hourly matching, toward genuine round-the-clock coverage forces a portfolio: solar for the day, wind for its evening and monsoon-season complementarity, and battery storage to move midday surplus into the neck of the curve. India’s round-the-clock RE tenders have already demonstrated the template, with blended wind–solar–storage portfolios bidding high-availability supply at tariffs that would have seemed implausible five years ago. For a data-centre operator, the procurement question stops being “which plant?” and becomes “which combination of assets, in which states, behind which contractual structure?”
Structure and geography then do as much work as generation. Open-access supply and captive or group-captive ownership carry materially different charge stacks — captive structures can escape cross-subsidy and additional surcharges entirely, at the price of equity participation in the generating asset. And state selection is driven by regulation as much as by fibre: banking provisions, open-access charge trajectories, and connectivity timelines vary so widely between states that the same portfolio can be viable in one and uneconomic across the border. Submarine cable landings decided where India’s first data-centre clusters sit; the electricity rulebook will have a growing say in where the next ones do.
Transmission Is the Real Constraint#
The global data-centre story of the past three years has been that interconnection, not capital, gates growth — grid-connection queues in Northern Virginia, connection moratoria around Dublin, Singapore’s pause on new builds. India’s version of the constraint is arriving on schedule, and it binds at both ends of the wire: grid connectivity for a 100–300 MW campus in a metro whose substations were never sized for it, and evacuation capacity for the wind–solar–storage portfolio in Rajasthan or Karnataka that is meant to serve it. A data-centre shell can be built in eighteen to twenty-four months; transmission bays, substation augmentation, and interstate corridor capacity move on multi-year timelines that no purchase order accelerates. The buyers who treat grid access as a long-lead procurement item (secured before land, alongside power) will set the pace of the buildout. The rest will own generation they cannot deliver to load they cannot energise.
What to Model Before Signing#
For a buyer whose load runs flat through a market this shaped, the difference between a good portfolio and an expensive one is invisible at annual resolution. Before committing to twenty-year contracts, a data-centre operator should be able to answer, quantitatively:
- Hourly versus annual matching: what does the portfolio’s carbon-free match look like block by block, not netted across a year? A 100% annually-matched portfolio can leave a third of actual consumption running on the grid’s evening mix — 15-minute matching is the only resolution at which a 24×7 claim can be verified or priced
- Banking rules as they will be, not as they are: banking is the implicit storage that makes many open-access economics work, and states have been steadily tightening it — from annual to monthly settlement, with haircuts. A portfolio underwritten on today’s banking provisions carries silent regulatory duration risk
- DSM exposure: deviation settlement charges accrue when scheduled and actual generation diverge — and wind and solar diverge daily. Someone in the contract chain bears forecast error at settlement prices linked to an increasingly volatile real-time market; the buyer should know who, and what it costs in a bad month
- Tariff and charge trajectories: open-access surcharges, transmission charges, and the retail tariffs that define the alternative are all moving. The economics of a captive structure versus open access versus grid supply should be stress-tested against charge trajectories, not point estimates
- Storage sizing against the shape: the battery is the portfolio component that converts belly-priced energy into neck-hour coverage. Undersize it and evening exposure persists; oversize it and the portfolio carries idle capital. The right size falls out of block-level simulation, not rules of thumb
Each of these is a 15-minute-resolution question. None of them can be answered with the annual spreadsheets that have historically underwritten Indian corporate PPAs — and getting them wrong is not a rounding error but a two-decade contractual commitment signed against the wrong curve.
Twelve Hours at the Ceiling#
In June 2026 the day-ahead market spent one unbroken stretch of 48 consecutive blocks at its ₹10/kWh ceiling. That is twelve hours without a break, and a data centre draws through every one of them at full rating.
Most industrial consumers have some answer to a stretch like that: a shift they can move, a process they can pause, a furnace they can bring forward. A data centre has none. Its load is the one thing on the site that cannot be rescheduled, which removes the cheapest tool available to everyone else.
That is why the supply question here resolves to storage and firming rather than to contracted volume. Signing more solar improves the annual matched figure and does nothing about the twelve hours.
The Most Demanding Buyer Is the Most Valuable One#
This is the standard EarthSync’s simulation engine was built for: modelling wind–solar–storage portfolios against a data centre’s flat load at 15-minute resolution (hourly carbon-free matching, banking and DSM exposure, state-by-state charge stacks, and tariff trajectories) so that a 24×7 portfolio is designed and stress-tested before the first PPA is signed, not discovered in the settlement statements after. India’s most demanding electricity buyers are about to become its largest. The market that learns to serve a flat, carbon-free load profitably will have solved, along the way, most of what the duck curve broke.