India’s duck curve has arrived: near-zero afternoons, $120/MWh evenings, and an average that shows neither
In April 2026, IEX’s real-time market cleared near zero across midday blocks and pinned the $120/MWh ceiling in the same weeks, while the day-ahead average moved one percent. The information in Indian power prices has migrated from the average to the intra-day shape.
On this page · 7 sections
One Average, Two Markets#
Read the April 2026 exchange data as a set of monthly averages and nothing much happened. The day-ahead market cleared at $63/MWh — up about one percent year on year. Volumes grew healthily: DAM and HP-DAM together traded 4,624 million units, up 8.7% on the year, and the real-time market traded 5,069 MU, up 30.2%, including a single-day record of 250 MU. A market getting bigger at a stable price — the picture of maturity.
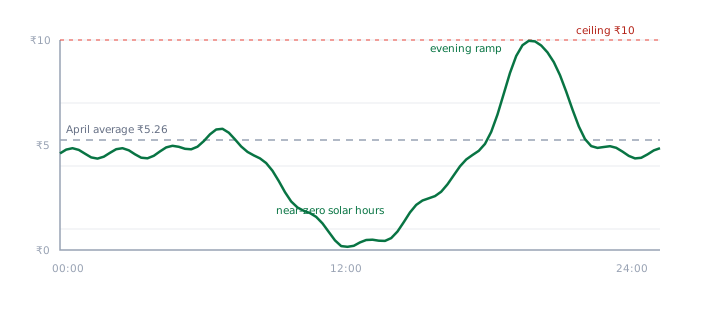
Now read the same month block by block. In multiple midday blocks, real-time prices touched near zero — surplus solar chasing insufficient demand. In the same weeks, evening and even midnight blocks repeatedly cleared at $120/MWh, which is not a price the market discovered but the regulatory ceiling it ran into. The day-ahead market saw midday blocks clearing as low as roughly $18/MWh. Within a single day, the market was worth close to nothing at 13:00 and everything the rules allow at 19:00.
This is the duck curve — the intra-day price profile named for its shape: a deep midday belly carved out by solar, a steep neck up the evening ramp, and a head at the peak. California met it a decade ago. India’s version has now moved from projection to published clearing prices, and it changes what every participant in the short-term market should be looking at. The average is no longer where the information is.
Why Midday Prices Collapse#
The mechanics are unglamorous and worth being precise about. The exchanges run uniform-price double-sided auctions: for each 15-minute block, an aggregate supply curve meets an aggregate demand curve, and the Market Clearing Price is discovered at the intersection. Every seller whose bid clears receives the MCP — which means the price in any block is set by the marginal unit, the most expensive generation actually needed in that block.
Solar has effectively zero marginal cost and, as must-run renewable capacity, bids at or near zero to secure clearing. Every gigawatt of new solar therefore pushes the supply curve to the right — but only in the blocks where the sun shines. Midday demand doesn’t rise to meet it: India’s system peak sits in the evening, and midday load is comparatively flat. So the intersection walks down the supply curve, past coal, past everything with a fuel bill, until the marginal unit in a midday block is another near-zero solar bid. That is how a market with a $63/MWh monthly average produces $18/MWh afternoons — and, in the real-time market, blocks that clear at almost nothing.
There is a self-reinforcing edge to this: economists call it price cannibalisation. New solar capacity depresses prices in precisely the blocks solar sells into. Each additional plant slightly lowers the revenue of every existing plant with the same generation shape — a dynamic that annual-average price forecasts are structurally incapable of representing.
Why the Evening Hits the Ceiling#
The far side of the duck is the mirror image. Between roughly 17:00 and 19:30, solar output collapses from near its daily maximum to zero — just as residential lighting and cooling load climbs toward the system peak. The grid must replace tens of gigawatts of generation within a couple of hours, from whatever can ramp: coal units constrained by technical minimums and ramp rates, hydro constrained by reservoirs and irrigation schedules, expensive gas, and a storage fleet that is still small relative to the job.
At the top of the supply curve, those resources are scarce and the curve turns nearly vertical. Evening demand, meanwhile, is inelastic — nobody switches off the lights because the exchange price moved. When an almost-vertical supply curve meets an unbending demand curve, the clearing price climbs until it hits the $120/MWh cap. A block clearing at the ceiling is a censored observation: the market’s true scarcity value may be higher, but the cap is where the tape stops. That April 2026 saw not only evening blocks but midnight blocks at the ceiling, hours after the conventional peak, says the tightness is no longer confined to the ramp itself.
Put the two halves together and the day’s price range, from near zero to $120/MWh, is roughly two hundred times larger than the year-on-year movement in the monthly average. All of the economic signal is inside the day.
What Merchant Exposure Means Under This Shape#
For anyone selling power without a contract (untied capacity, expiring PPAs, surplus beyond contracted volumes) the relevant price is not the market average but the capture price: the generation-weighted average of the blocks you actually sell into. A solar plant’s capture price is computed almost entirely inside the duck’s belly. As the belly deepens, a merchant solar plant can watch its realised revenue fall in a year when the headline market average rose. The gap between average price and solar capture price, the capture discount, is now a first-order line item in any merchant revenue model, and it widens mechanically with every gigawatt of solar commissioned.
The same logic runs through contract negotiation. A flat-price PPA is cheap or expensive only relative to the shaped market curve behind it. A buyer signing a flat $48/MWh tariff is paying well above the market for midday units and well below it for evening units — which is a fine trade or a poor one depending entirely on the buyer’s consumption shape. Pricing a PPA against the average is pricing it against a number no block actually clears at.
Who Wins, Who Loses#
- Storage wins first: the duck curve is the BESS business case, printed daily. Charging in near-zero midday blocks and discharging into ceiling-priced evening blocks offers spreads that April 2026 stretched toward $96–120/MWh on the best days — and every deepening of the belly widens the spread. The constraint is no longer whether arbitrage pays, but forecasting which blocks to commit to
- Flexible consumers win quietly: an open-access consumer who can shift drawal into the belly (scheduling energy-intensive processes into midday, procuring through the exchange for those blocks) is buying some of the cheapest utility-scale power ever sold in India. Timing of drawal is becoming as valuable as volume of drawal
- Merchant solar loses steadily: plants selling into the exchange without storage or contracts sell into the belly by construction. Their capture discount deepens with every competitor commissioned — the volume-weighted price they receive detaches further from the average every year
- Flat-PPA parties trade blind: generators shielded by flat tariffs are insulated for now, but every renegotiation, extension, and new contract is being priced against a shaped curve. Buyers with evening-heavy load shapes are discovering that a flat solar PPA hedges the hours they least need hedged
- The grid pays for the neck: DISCOMs and the system operator carry the evening ramp — procuring expensive peaking power, cycling coal units harder, and leaning on the real-time market, whose 30% year-on-year volume growth is partly the sound of intermittency being managed close to delivery
Four Years of the Same April#
The shape is easier to argue about with a time series than a snapshot. Taking April on the day-ahead market and holding the month constant to strip out seasonality, the day-wide average has barely moved since 2023: ₹5.42, then ₹5.11, ₹5.20 and ₹5.26 per kWh. On that evidence the market looks stable, even dull.
What a solar plant earned across the same four Aprils did not stay stable. The 08:00 to 16:00 window averaged ₹3.23, then ₹3.01, ₹2.12 and ₹1.59. As a share of the day average, solar's capture rate went 59.6%, 58.9%, 40.7%, 30.2%. Extend the series back to April 2022 and it starts at 81.1%, though that year carried an unusually high ₹10.06 day average during the coal-supply squeeze, so the fair comparison is the four years since.
The average is flat and the thing being averaged has changed underneath it. A developer who underwrote in 2023 on an average-price assumption, and reviewed it annually against the same average, would have seen a stable market for four years while the revenue their asset actually captured fell by nearly half. Nothing in the headline number would have warned them.
This is value deflation, or price cannibalisation. Each additional gigawatt of solar clears in the same hours as every existing gigawatt, pushing that window further down the supply stack and lowering the price all of them receive. It is a structural consequence of correlated generation, not a market failure, and it does not reverse on its own. Storage and demand that can move into the trough are what arrest it.
One correction to how the evening is usually described, from the same data. The scarcity is not centred on the 18:00 to 21:00 window. In June 2026, 5% of blocks in the 18:00 hour cleared at the ₹10/kWh ceiling, against 96% of blocks from 22:00 onward. The tightest hours are late, after the conventional peak has passed, which matters directly for anyone sizing storage against an evening-peak assumption.
Averages Are Now a Liability#
Every analysis built on average prices (a merchant revenue projection, a PPA benchmark, a storage payback model, an open-access procurement decision) now carries a systematic error term, and the error grows as the duck deepens. The direction of the error is not random: averages flatter shape-mismatched assets and understate shape-matched ones. An annual-average model will overvalue merchant solar, undervalue storage, and misprice every contract in between.
The unit of analysis has to match the unit of settlement: the 15-minute block, 96 of them a day. That is the resolution at which EarthSync’s market intelligence and simulation engines operate — forecasting DAM, GDAM, and RTM prices block by block, and scoring generation, storage, and procurement decisions against the shaped curve rather than the average that hides it. April 2026 was the month the duck curve stopped being a chart from California. The averages will keep looking calm. The blocks will not.