DAM, GDAM, RTM: how India's power exchanges actually work
India's short-term power markets clear on three different clocks, a day ahead, near real time, and the term-ahead space in between. Here's how each segment discovers its price, and why the patterns matter to anyone buying or selling power.
On this page · 8 sections
Where the Exchanges Fit#
The large majority of electricity in India is sold under long-term power purchase agreements between generators and distribution companies (DISCOMs), signed years before the power flows. The short-term market (power exchanges, bilateral trades through licensed traders, and the deviation settlement mechanism) accounts for a modest share of total generation. But it prices the marginal unit, and the marginal unit sets the reference for everything else: PPA negotiations, open access economics, storage business cases, and DISCOM procurement strategy.
India has three power exchanges — the Indian Energy Exchange (IEX), Power Exchange India Limited (PXIL), and Hindustan Power Exchange (HPX) — with IEX handling the overwhelming majority of traded volume. Exchange trades are "collective transactions" regulated by the Central Electricity Regulatory Commission (CERC) and scheduled through the national and regional load despatch centres like any other interstate flow. Delivery is physical: this is a market for electricity, not a financial derivative of it.
The Day-Ahead Market (DAM)#
Official product page: iexindia.com/…/day-ahead-market.
A Double-Sided Auction, 96 Blocks at a Time
The DAM is the anchor segment. Every day, buyers and sellers submit bids between 10:00 and 12:00 for delivery across the following day, which is divided into 96 blocks of 15 minutes each. Bids are price–quantity pairs per block; participants can also place block bids that span multiple consecutive blocks on an all-or-nothing basis.
That all-or-nothing condition matters more than it sounds: it makes the clearing problem non-convex, so it cannot be solved as a plain linear program. One consequence is the paradoxically rejected block, a block bid that is in the money at the clearing price and is still rejected, because accepting it would have reduced total welfare rather than increased it.
Because both sides bid, the exchange constructs an aggregate demand curve and an aggregate supply curve for every 15-minute block, and the Market Clearing Price (MCP) is discovered where the two intersect. The structure has a formal name: a double-sided uniform-price auction. Double-sided because buyers and sellers both submit bids, rather than buyers bidding into a fixed supply; uniform-price because every cleared trade settles at that one intersection price, whatever the participant themselves bid. Bidding your true willingness to pay is therefore the rational strategy, which is what makes the discovered price a credible signal.
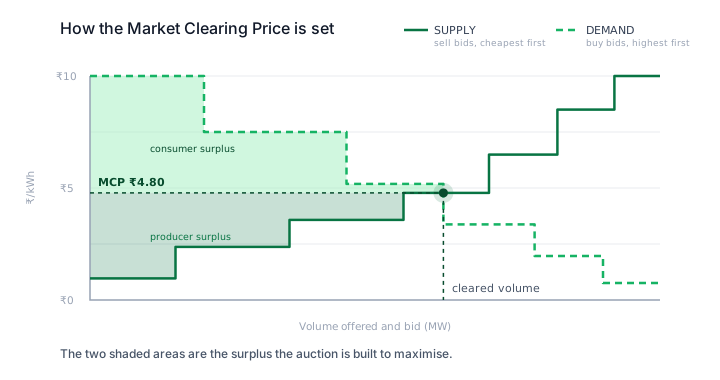
The intersection is not simply where the two lines happen to meet. The exchange's clearing engine solves an optimisation, and its objective is social welfare maximisation: the largest achievable sum of consumer surplus and producer surplus. Consumer surplus is the gap between what a buyer was willing to pay and the MCP they actually pay. Producer surplus is the gap between the MCP a seller receives and the price they would have accepted. Clearing anywhere other than the intersection shrinks one of those areas without enlarging the other, which is why the crossing is the point the algorithm is built to find.
When the interregional transmission corridors cannot carry all the cleared trades, the market splits: congested regions clear at their own Area Clearing Price (ACP), with surplus regions clearing lower and deficit regions higher. Results are published in the early afternoon, giving every participant (and every observer) a forward curve of 96 prices for tomorrow. That curve is one of the most-watched datasets in the Indian power sector: it moves DISCOM procurement decisions, storage dispatch plans, and the internal benchmarks against which PPAs are negotiated.
The Green Day-Ahead Market (GDAM)#
Official product page: iexindia.com/…/green-market/green-day-ahead-market.
Launched in October 2021, the GDAM runs alongside the conventional DAM in the same bidding window, but the power traded carries its renewable attribute with it. Sellers are renewable generators; buyers, typically DISCOMs and open access consumers, can count purchased green power toward Renewable Purchase Obligation (RPO) compliance.
Price discovery works the same way: double-sided auction, uniform clearing, 15-minute blocks. GDAM prices track conventional DAM prices closely but can diverge when compliance demand is strong — the spread between the two is effectively the market's price on the green attribute itself. For a renewable generator with uncontracted capacity, the GDAM offers a route to monetise both the energy and its greenness in a single trade.
The Real-Time Market (RTM)#
Official product page: iexindia.com/…/real-time-market.
The RTM, launched in June 2020, is the segment closest to delivery. It runs 48 auction sessions a day — one every half hour, around the clock. Each session is a double-sided closed auction, exactly like the DAM in miniature, clearing power for a half-hour delivery period (two 15-minute blocks) that begins after a gate closure roughly an hour ahead of despatch.
The RTM exists because forecasts are wrong. A DISCOM whose demand came in above its day-ahead estimate, a wind generator whose output is falling short of schedule, an industrial consumer whose process tripped — all of them can correct their position in the RTM instead of deviating from schedule and paying deviation charges. As renewable penetration grows, the RTM increasingly carries the system's intermittency, and its prices are correspondingly more volatile than the DAM's.
Term-Ahead and Longer Contracts#
Between the day-ahead auction and bilateral PPAs sits the Term-Ahead Market (TAM): intraday contracts, day-ahead contingency, and daily, weekly, and monthly contracts stretching from the same day out to several months ahead. These are matched continuously or in periodic sessions rather than cleared in a single uniform auction, and volumes are thinner than the DAM's. For buyers, the TAM is chiefly a hedging instrument — locking in a known price for a known period when the day-ahead outlook is uncomfortable.
What the Cleared Prices Actually Show#
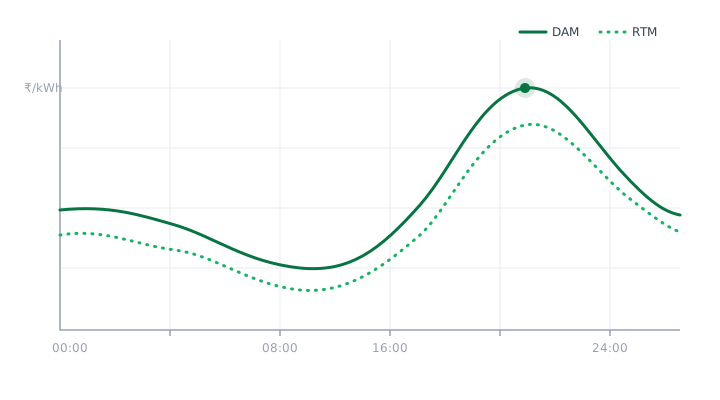
Averaged across June 2026, the day-ahead market cleared at ₹5.17/kWh. A plant that generates only in solar hours did not earn that. Between 08:00 and 16:00 the average was ₹1.63, which is 31.6% of the day average, while the 18:00 to 23:00 window averaged ₹8.10. That ratio is the capture rate: the share of the average market price a generator realises, given when it produces. It decides whether a merchant solar project works, and it is invisible in any analysis that uses an annual average tariff.
The second finding is less expected, and it cuts against the way the evening peak is usually described. Scarcity is normally placed between 18:00 and 21:00. The cleared blocks put it later. In June 2026, 5% of 18:00 blocks touched the ₹10/kWh ceiling, against 91% at 21:00, 96% at 22:00 and 97% at 23:00, and it was still 84% at midnight and 57% at 02:00. The binding hours are the late night, after the conventional peak has passed. A battery sized against an 18:00 to 21:00 peak is sized against the wrong hours.
A third number cuts both ways. Real-time cleared below day-ahead in 47% of blocks, with a mean spread of ₹0.80 below. Leaving volume to the real-time market is therefore not a saving; it is a position, roughly a coin flip on direction with a modest average tilt. The median day itself travelled from ₹1.09 to the ₹10.00 ceiling, a nine-fold range inside twenty-four hours.
Why Prices Swing#
Exchange prices are shaped by a handful of recurring structural patterns:
- Solar hours: as solar capacity has grown, midday blocks routinely clear at very low prices — the supply curve is flooded with must-run generation bidding near zero. The cheapest power of the day is now typically found between late morning and mid-afternoon
- The evening ramp: when solar output collapses into the evening demand peak, the system leans on coal, hydro, gas, and storage. The evening blocks are persistently the day's most expensive, and the morning pickup shows a smaller twin of the same effect
- Seasonality: summer heat and agricultural loads push demand and prices up through the hot months; a good monsoon brings wind and hydro onto the system and softens prices; winter evening peaks tighten the market again in northern India
- Supply shocks: coal stock positions, plant outages, transmission constraints, and heatwaves can push prices to the regulatory ceiling for sustained stretches — the price cap exists precisely because scarcity has tested it
Who Should Care#
- Open access consumers: buying from the exchange through short-term open access is a real alternative (or complement) to a PPA. But exposure to block-wise prices means the consumption shape, not the annual volume, decides whether it is a good one
- IPPs with merchant exposure: any generator with untied capacity, expiring PPAs, or surplus beyond contracted volumes is selling into these markets — and the difference between selling into depressed midday blocks and high-value evening blocks is the difference between thin and healthy returns
- Traders and DISCOMs: portfolio managers arbitrage between segments daily — buying day-ahead against real-time expectations, and using the TAM to hedge known deficits
- Anyone signing a PPA: the exchange price curve is the opportunity cost behind every PPA negotiation. A fixed tariff is cheap or expensive only relative to what the market clears at, block by block
The three segments are best read as one price signal sampled at different distances from delivery. The DAM tells you what the market expects, the RTM tells you what actually happened, and the spread between them tells you what forecast errors cost. Any serious analysis of open access purchase, merchant sale, or storage arbitrage has to engage with that signal at its native resolution: 15 minutes.
Frequently asked questions
- What is the difference between DAM, GDAM, and RTM on Indian power exchanges?
- The DAM clears next-day power in 96 fifteen-minute blocks in a single morning auction; the GDAM runs alongside it for renewable power that carries its green attribute; the RTM runs 48 half-hourly auctions through the day for corrections close to delivery.
- How is the Market Clearing Price (MCP) discovered?
- Through a uniform-price double-sided auction: an aggregate supply curve meets an aggregate demand curve for each block, and every cleared buyer pays (and every cleared seller receives) the price at their intersection.
- Why do exchange prices collapse at midday and spike in the evening?
- Near-zero-marginal-cost solar floods the midday supply curve while the evening ramp leans on scarce flexible capacity — the duck-curve shape now visible in Indian clearing prices.